
What is the Semantic Layer?
The holy grail of self-service analytics that overpromises and underdelivers perennially

The problem with Semantic Layers is not the technology. It’s the complete lack of understanding on how and when to deploy it. Teams either hate it and avoid it or think its a panacea for all of their self-service analytics problems. If you’re in either camp, your Analytics program will stall out and never reach escape velocity. And in this age of AI where Semantic Layers will be crucial, your company will be at a severe disadvantage. It’s now absolutely critical that you understand this technology and how it fits into to your analytics stack.
An Active Abstraction
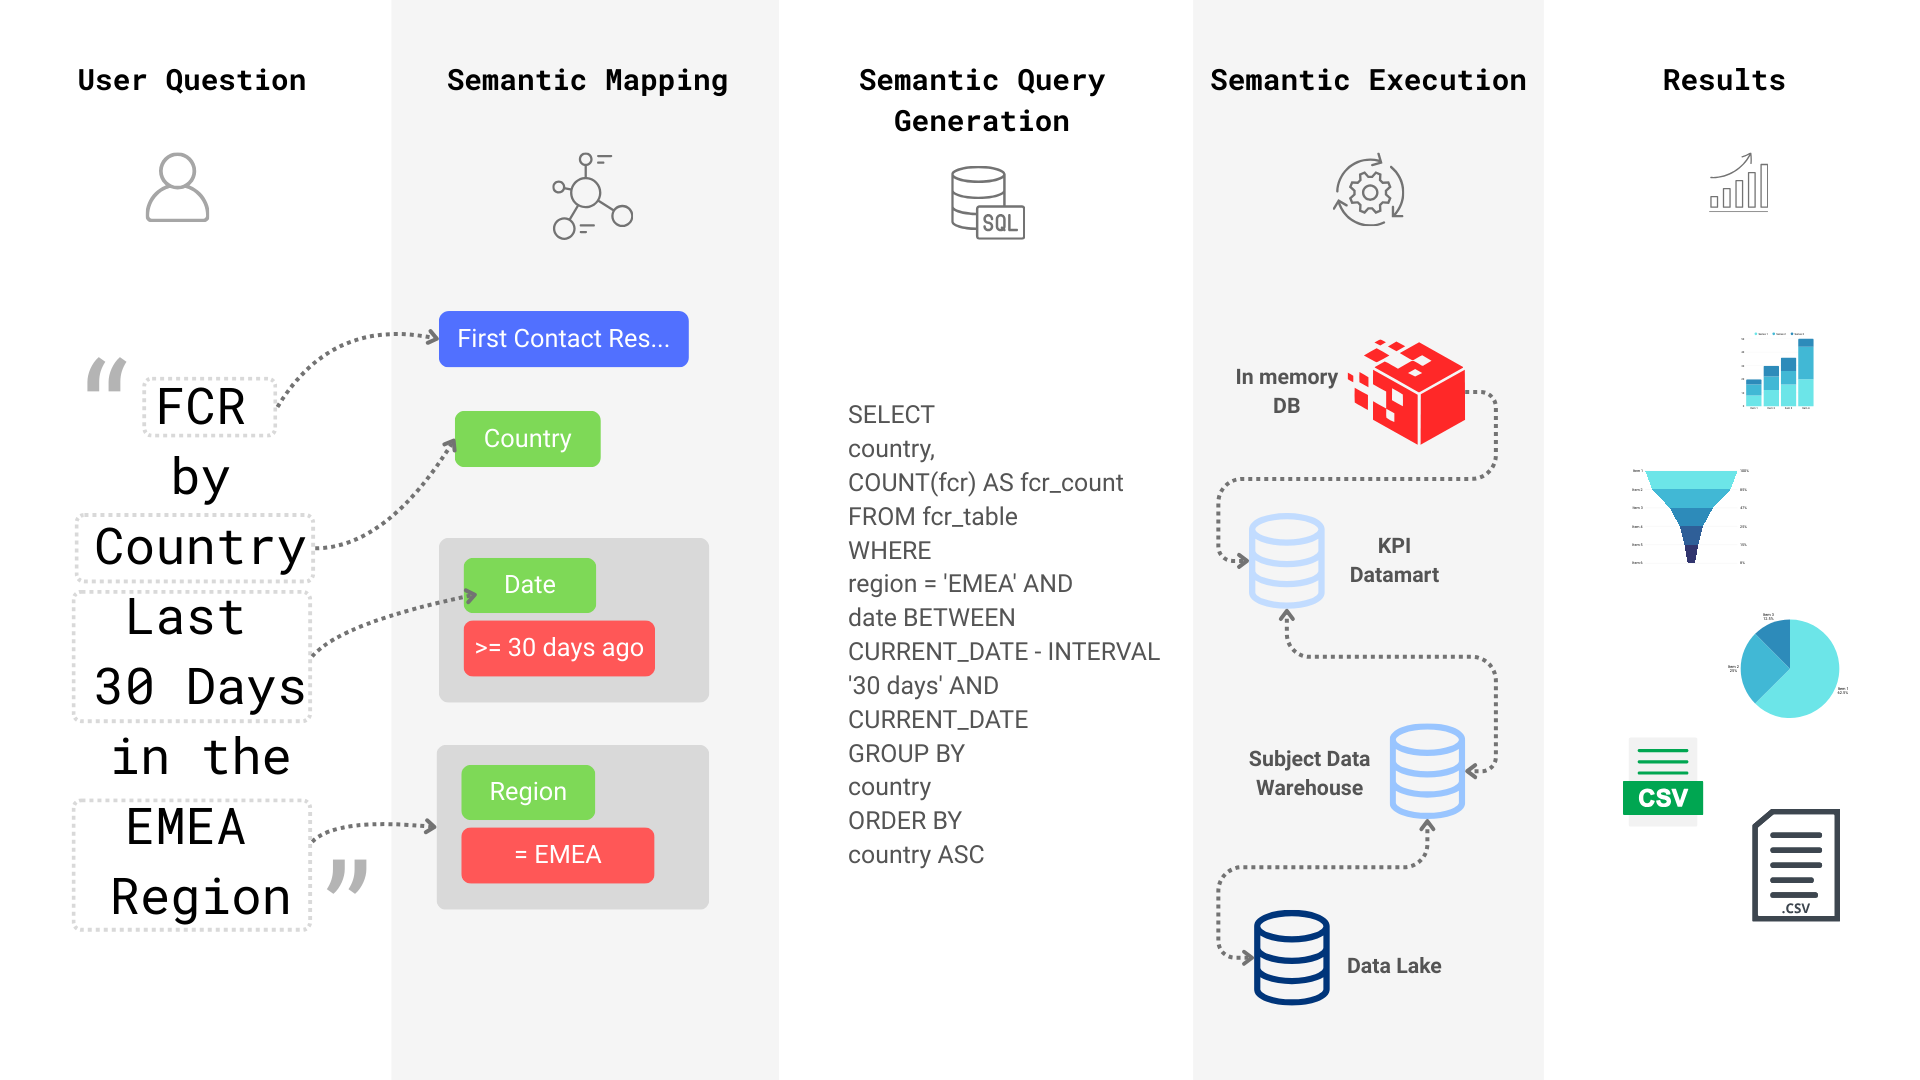
Let’s get into the tech first. Semantic Layers bridge the gap between your business concepts and your physical database. For example, suppose you are running a customer service team with call centers etc. You might be tracking a common metric called First Contact Resolution Rate by Country. Here the business concepts are First Contact Resolution Rate (FCR) and Country. These then map to a database called cs_dwh, a column in the contact_f table called country_origin_iso_code, and a metric defined as sum(first_contact_resolution_cnt)/sum(num_contacts). (Don’t worry if this is confusing, clarity is on the way). Notice how much more transparent and simple the business terminology is versus how the data is actually stored.
You could simply document this mapping and call it a semantic layer, and some do, but that would only be useful for highly technical users.
What we have in Semantic Layers is an Active Abstraction. Its active in that, it can take user input like “Last 30 day FCR by Country”, connect to the appropriate database, construct and issue the correct query, and return results in meaningful formats.
If you didn’t know anything about Business Intelligence or Semantic Layers, you can understand the potential here. You start to wonder what if everyone in your company has fast access to high quality data? And, what if all our data needs are intermediated by a Semantic Layer so we can have a single source of truth? At first it looks like many of your problems with governance and self service could be one shotted with a Semantic Layer. But this is also where your problems start. Going down this road to extreme adoption of Semantic Layers will lead to frustration and eventual abandonment.
Your thinking “how does he know this”? Well dear reader, I’ve been working in this industry for over 20 years and I’m obsessed with Semantic Layers. This will be the third time I build a Semantic engine from scratch. I might be one of a handful of experts in the world who understand how to build one and how to deploy it successfully. Before we get into succeeding with this technology, let’s dive into why extreme adoption will lead to failure.
What if Everyone has Access to Data?
“Democratize data!”
“Every decision is now data driven.”
“You must use the enterprise standard Semantic Layer for all your analytics need.”
It always starts with so much promise and then you take it too far. Now millions of dollars in investment are wasted and the users are gone. Where did we go wrong?
First, you didn’t match the technology to the right users and domains. Instead, you built for everyone and every domain. Semantic Layers, when done right, enables a level of self service that is closer to raw data than curated dashboards. Also, besides the basic semantics, it is mostly context free. This means if you are not an operator within the domain in question, you could easily get lost.
Second, teams try to build a cross domain Semantic Layer across the entire enterprise. This goes wrong a number of ways. Everything from the politics of semantics (who gets to call their metric “Revenue”) to the variable quality across domains. Additionally, it turns out only a minimal amount of cross domain insights are useful in a self service context. The most enabled users are operators. They are primarily interested in the domain they operate in. They need to go deep not broad. Teams in this situation end up building broad rather than deep.
Third, you mandated the use of one tool to rule them all. It covers your exploratory visualization needs, your interactive dashboarding needs, your data science needs, and your self service reporting needs. All built on top of a universal semantic layer. Guess what, it sucks at every one of those use cases. Its optimized for no one’s happiness. A person who is capable of exploring the raw data via direct querying has little need for a Semantic Layer. Same goes for the Data Scientist and Engineers. For them, a Semantic Layer is a means to bootstrap queries rather than a direct interface to the data.
The Semantic Middleware
“Lets take all of our access layers (BI Tools, Visualizations, Notebooks etc) and make them query through the Semantic Layer”.
“Single source of truth!”
“No more governance issues.”
This is going to fail harder than federated data warehousing from a few decades ago. A couple of vendors and a small cadre of Tech companies are trying to make this happen. Long story short, it ain’t happening.
A Debugging Nightmare
When you stack abstractions upon abstractions — as is the case with BI tools connecting to a third party Semantic Layers — you better be prepared for debugging marathons.
The BI tool in question will of course have its own abstraction as it maps your data to its internal model. It is designed to work without such a middleware to begin with. Now when the CEO asks why Revenue on his pretty dashboard is wrong where do we look:
The metric as defined in the Dashboard
The metric as defined in the BI tool
The query generated by the BI tool
It could be how the metric was interpreted by the Semantic Layer. I.e. It knows of a multiple metrics called Revenue and chose the wrong one.
The metric as its defined in the Semantic Layer
The query generated by the Semantic Layer is wrong
The data in the actual database is wrong
Some will say only 7 places to look, not bad. Good luck to you!

It can’t be the Single Source of Truth
As mentioned above, not matter what, your BI tools need to map your data to its own internal model. Take Tableau for instance. Even though you connect to data via the Semantic Layer, you still have to define local metrics in the workbook. What is stopping anyone from changing metric definitions using components from the Semantic Layer? That’s right, nothing!
One of the main reason we have inconsistent metric definitions is people. Not tools, or documentation or some process. Its people and politics. And most of the time they have a good reason to have a flavor of metric that is slightly different. This should be totally fine! We just have to be good about using different names.
Performance will Suck
If not today, eventually. It will become expedient to solve problems with your data model in the Semantic Layer. Issues that should be a proper ETL or Data Model change will come find their way into the Semantic Layer. Most current Semantic Layers are already slow (5 seconds or longer per query) by its nature. They are designed to query against data warehouses which in the context of big data are not meant for sub second response times. You just can’t deliver high performance interactive dashboards given the latency.
Well you could, if you wanted inflicting suffering on your colleagues.

To address this need to power interactive dashboards semantically. Vendors will pitch their proprietary in memory OLAP solutions (aka cubes). As of now these tend be incoherent with the existing Semantic Layer. Meaning, you can derive cubes from the base layer but they operate independently. You have to direct queries at the cube and or the cube has its on lite semantic model which differs from the base model.
Even if you could solve the performance issue with cubes, it doesn’t matter in the end. A capable Analytics Engineer building high impact interactive dashboards will only be slowed down and held back by the Semantic Layer. I’m talking about executive dashboards here with broad visibility. Not one off interactive set of charts.
You’ll pay for performance one way or the other. Slow dashboards or long development cycles or both.
So.. Semantic Layer Bad?
Absolutely not!
The Semantic Layer is one of the highest leverage investments you can make on your data assets. It is the penultimate debugging tool for your business. Today, most non-technical users access data via interactive and static dashboards. However, less than 1% of data is accessible via these modalities. You didn’t spend millions of dollars per year to move, process, and store data just for it to sit idle. Lets unpack the real value here.
The Right User: Non-Technical Domain Experts
At Netflix, where I successfully built and deployed a Semantic reporting tool, I coined the term “Non-technical Domain Experts.” They are an underserved class of users who are hungry for data. Interactive dashboards are less than useful for them. They are operators who directly influence business decisions in real time. Some are charting a new course for your product. And others are tracking down that last dollar.
Non-Technical Domain Experts
While they may not be technical in the sense that they can’t write an ETL pipeline or even basic SQL queries, they are masters of their business area. Whether its a subdivision of a subdivision, a whole department, or a product line, these folks are all over your company. When shit hits the fan, these are the folks that tell you what’s happening on the ground from a data perspective.
They understand the KPI’s and associated metrics better than the technical team who put them together. Your data engineers understand the technical nuance of a metric, these people understand the business nuance.
You’ll find them influencing or making key business decisions. Decisions like where to deploy staff, how much inventory to buy right now, which bugs to fix tomorrow, and how much revenue will product A land this month. They might have “Analyst” in their title but that’s not always the case. And finally, they are often wizards with Excel.
Now imagine that this cohort in your company is not limited to simple dashboards. Nor, are they sitting around waiting for engineers to answer basic questions. That they can dig deep into your data to make the right call at the right time. This my friends is the real unlock.
The Right Use Cases
Can you build interactive dashboards on a powerful Semantic Layer? Sure, but you should not optimize for that. The class of users and use cases served by interactive dashboards are different. Dashboards are designed to summarize KPI’s and disseminate data to a broad user base. Much will be done to improve performance and usability. These exigencies will clutter and confuse your Semantic Model.
Generally, operational reporting is an obvious top use case. The only thing I’ll say here is that at the enterprise level you should think carefully before relying exclusively on canned reports that come with your solution. These are often devoid of rich data that is available in your data warehouse.
Here’s how to find other potential users:
They frequently go from KPI’s to transactional data
They frequently need custom filters and groupings added to existing dashboards and reports
They want to download the entire dataset backing a dashboard
They are constantly making requests for custom data pulls
These are some of the right targets and they are in almost every domain.
Determinism for your Probabilistic AI
We are in the midst of an epic tech cycle lead by Artificial Intelligence. Computers can finally talk to us and we can talk back in plain english. This is amazing and has done wonders for my productivity as it likely has for you.
However, as we all know by now there is a huge caveat. Large language models that power our current generation of AI tech are probabilistic by nature. That means answers to a question are non deterministic. Even if you had the funds to train your entire data warehouse, it will some of the time give you the wrong answer. In fact, it will give you different answer just for merely phrasing the question differently. And sometimes the answer to a question can be different between model upgrades.
Your CEO doesn’t want you to guess how much Revenue the company will close this month. Nor does she want a KPI that changes with every refresh of the dashboard.
A Semantic Layer has the potential to bring enough determinism to your LLM deployments to make it useful in the context of enterprise analytics. More on that and what we are doing about it at Strata in future posts.
Recipe for Success
Okay, so you’ve bought in, found the right users, and the right use cases. You know how to avoid extreme adoption. Whats next?
Analytics Stack
We need to first understand our Analytics stack. You should think of it as a funnel where you have the most users with shallow usage at the top and the bottom will have few users but intense usage. It might look something like this:
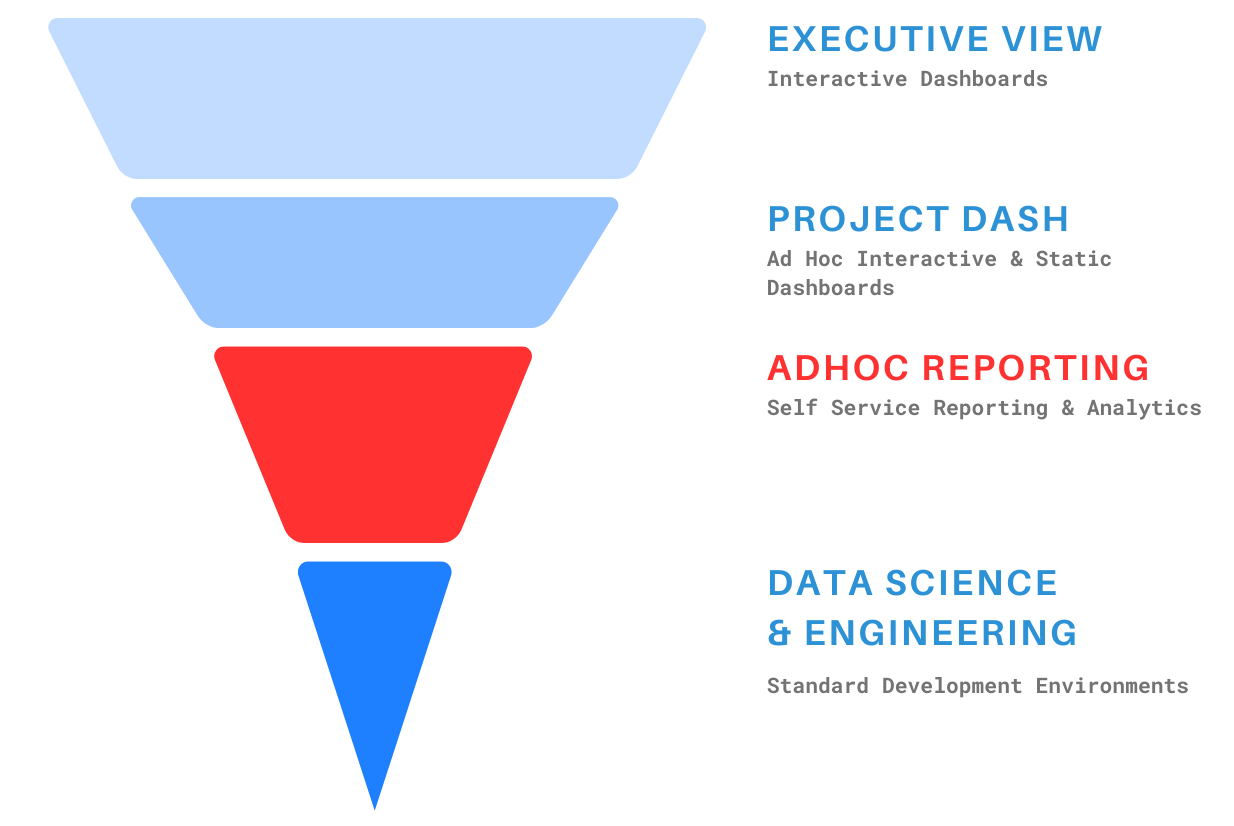
Every organization is different and you might have some differences. This captures an average view of enterprises. The width represents the number of users and the depth represents the intensity (i.e. use it several times a day vs once a month).
Notice the red above. This is where you need to slot in the Semantic Layer. Less users than Executive View consumers, but very intense. I should say it has the potential for intense usage given a good Semantic Layer powered self service tool. Now that we’ve identified where in our stack it fits and for what use case, we need to build a data model.
Data Modeling
This will be your first stumbling block. Don’t let endless debates over building the perfect enterprise model derail your mission. The mission being to enable deep self service access to a specific set of users in a specific domain. Look I would love an enterprise data model with all the bells and whistles too. But, you can get there iteratively without boiling the ocean all at once.
How good the data model is will depend on your Semantic Layer technology. Some are quite dumb and will need a lot of help and others are more forgiving. We are building the latter at Strata but with some developer optimizations to grow with the team.
We’ll post more on this topic in the future. So subscribe!
A Curator with Taste
It was never going to be that easy. This isn’t absolutely necessary but it will really unlock value in ways you can’t understand until you see it in action. This person doesn’t have to do this as full time job. The initial development will be intense but after that it can be maintained on a part time basis. They can be one of the domain experts who partner with your Data Engineers, or a Data Engineer. Nonetheless, you need someone to be the lead curator.
But, why?
The Semantic Layer can be described as labels that point to data assets. These labels can be created haphazardly or with deep empathy. You have to understand how the users in the domain think, what is important, and how the Semantic Layer will impact their workflow. Some data will need to be cached because its used often while others can stay in deep storage.
Think of this role as your editor. Everything in your data model isn’t useful and many things need to be renamed to fit the mental model of your target users.
With that final piece in place you are now ready to unlock the true value of Semantic Layers.
Summary
Congratulations on reading this far! Your going to be among the leaders who run successful analytics programs. By now you should understand how to screw up a Semantic Layer deployment and also how to succeed.
I’d love to hear your comments or feedback. Will try to answer as many as I can. In the mean don’t forget to subscribe. Strata is building the next generation of Self Service reporting and analytics with Semantic Layers.